
|
How can we transport and inject
large quantities of CO2?
|
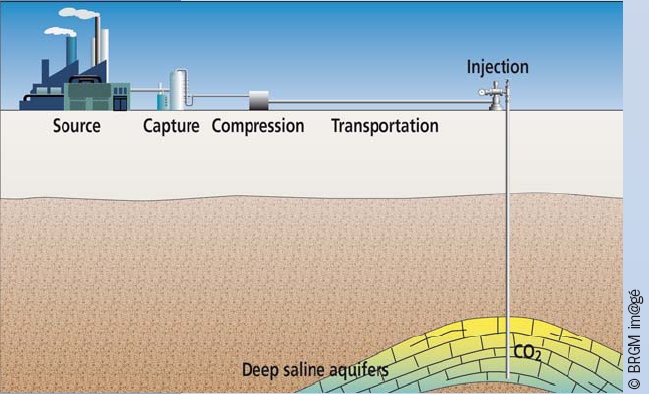
After its capture at the industrial facility, the CO2 is compressed, transported, and then injected into the reservoir formation through one or several wells. The whole chain has to be optimized to enable the storage of several millions of tons of CO2 per year.
Compression
CO2 is compressed into a dense fluid form that occupies significantly less space than a gas.
Once the CO2 has been separated from the flue gas in the power plant or industrial facility, the resulting highly concentrated CO2 stream is dehydrated and compressed, making transport and storage more efficient (Fig. 1). Dehydration is necessary to avoid corrosion of equipment and infrastructure and, under high pressure, the formation of hydrates (solid ice-like crystals that can plug equipment and pipes).
Compression is carried out together with dehydration by a multistage process: repeated cycles of compression, cooling and water separation. Pressure, temperature and water content all need to be adapted to the mode of transport and to the pressure requirements at the storage site. Key factors for the design of the compressor installation are gas flow rate, suction and discharge pressures, heat capacity of the gas, and efficiency of the compressor. The technology for compression is available and already widely used in many industrial fields.
|
Figure 1
Stages of geological storage of CO2. In order to bring CO2 from its emission point towards its safe and durable storage, it has to go through a whole chain of operations including capture, compression, transportation and injection.
|
Transportation
CO2 can be transported by either ship or pipeline.
Ship transportation of CO2 is currently only operated at very small scales (10,000-15,000 m3) for industrial uses, but this could become an attractive option in the future for CCS projects where a near-coast source is very far from a suitable reservoir. The vessels used for transporting liquefied petroleum gas (LPG) are suitable for CO2 transportation.
In particular, the semi-refrigerated systems are both pressurized and cooled, and thus the CO2 can be transported in the liquid phase. The newest LPG ships have volumes of up to 200,000 m3 and are capable of transporting 230,000 t of CO2. However, ship transport does not provide continuous flow logistics, and intermediate storage facilities are required at the port to handle the reloading of CO2.
Pipeline transportation is currently employed for large quantities of CO2 used by oil companies in Enhanced Oil Recovery* (approximately 3000 km of CO2 pipelines in the world, most in the United States). This is more cost-effective than ship transportation and also offers the advantage of providing a continuous flow from the capture plant to the storage site.
Existing CO2 pipelines all operate at high pressures under supercritical conditions for CO2 under which it behaves like a gas but has a liquid density. Three important factors determine the quantity that a pipeline can handle: its diameter, the pressure along its length and, consequently, its wall thickness.
Injection
When the CO2 arrives at the storage site, it is injected under pressure into the reservoir (Fig. 2).
Injection pressure must be sufficiently greater than reservoir pressure to move the reservoir fluid away from the injection point. The number of injection wells depends on the quantity of CO2 to be stored, the injection rate (volume of CO2 injected per hour), the permeability and thickness of the reservoir, the maximum safe injection pressure, and the type of well. As the main objective is the long-term containment of CO2, we must be certain of the hydraulic integrity of the formation.
High injection rates can cause pressure increases at the point of injection, particularly in low-permeability formations. Injection pressure usually should not exceed the fracture pressure of the rock as this may damage the reservoir or the overlying seal. Geomechanical analysis and models are used to identify the maximum injection pressure that will avoid fracturing the formation.
Chemical processes might affect the rate at which CO2 can be injected into the formation. Depending on the reservoir rock type, the composition of the fluids, and the reservoir conditions (such as temperature, pressure, volume, concentration, etc.), mineral dissolution and precipitation processes can occur near the well. This can lead to increased or decreased injection rates. As soon as CO2 is injected, part of it dissolves in the salty reservoir water and the pH* slightly decreases, buffered by the dissolution of carbonate minerals present in the host rock.
Carbonates are the first minerals to dissolve as their reaction rate is very high and dissolution starts as soon as injection begins. This dissolution process can increase the porosity of the rock and the injectivity*. However, following dissolution, carbonate minerals can re-precipitate and cement the formation around the well. High flow rates can be used to limit permeability reduction near the well, thus displacing the geochemical equilibrium area of precipitation farther away.
Drying is another phenomenon induced by injection. After the acidification phase, the residual water that has remained around the injection well dissolves in the injected dry gas, which in turn concentrates chemical species in the brine*. Minerals (such as salts) can then precipitate when the brine is sufficiently concentrated, thus reducing permeability around the well.
These injectivity issues depend on complex interacting processes that occur locally around the injection well, but that are also highly dependent on time and distance to the injection well. Numerical simulations are used to assess such effects. Injection flow rates need to be carefully handled to overcome processes that might limit the injection of the desired quantities of CO2.
|
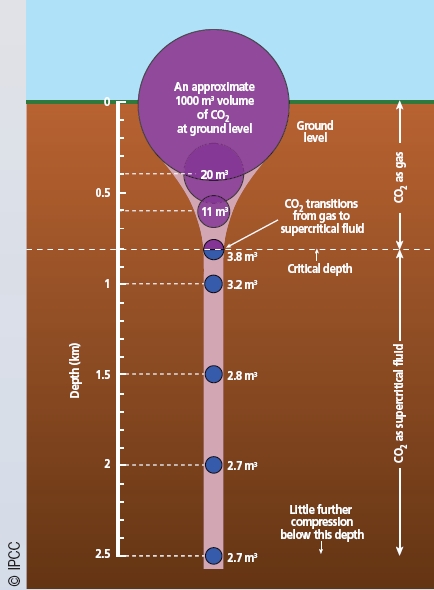
Figure 2
When injected underground, CO2 becomes a dense supercritical* fluid at around 0.8 km depth. Its volume is dramatically reduced from 1000 m3 at the surface to
2.7 m3 at 2-km depth. This is one of the factors that makes the geological storage of large quantities of CO2 so attractive.
|
CO2 stream composition
The composition and purity of the CO2 stream, which are a result of the capture process, have a significant influence on all subsequent aspects of a CO2 storage project. The presence of a few percent of other substances, such as water, hydrogen sulphide (H2S), sulphur and nitrogen oxides (SOx, NOx), nitrogen (N2) and oxygen (O2), will affect the physical and chemical properties of the CO2 and its associated behaviour and impacts. The presence of such substances must therefore be carefully considered when designing the compression, transportation and injection phases and also when adjusting the operating conditions and equipment.
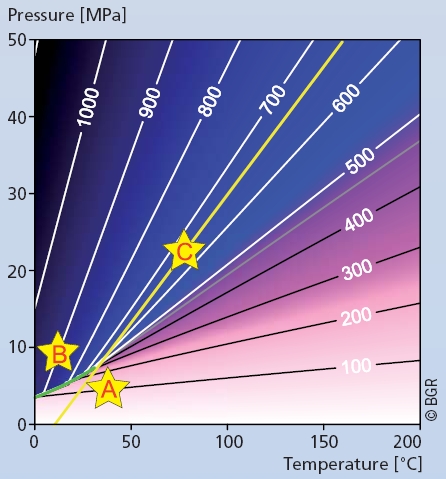
In conclusion, the transportation and injection of large quantities of CO2 is already feasible. However, if the geological storage of CO2 is to be widely deployed, all the stages involved need to be tailored to each storage project. The key parameters are the thermodynamic properties of the CO2 stream (Fig. 3), flow rates, and upstream and reservoir conditions.
|
Figure 3
Density of pure CO2 (in kg/m3) as a function of temperature and pressure. The yellow line corresponds to a typical pressure and temperature gradient in a sedimentary basin. At depths greater than 800 m (~8 MPa), reservoir conditions facilitate high densities (blue shading). The green curve is the phase boundary between gaseous and liquid CO2. Typical pressure and temperature conditions for capture, transport and storage are indicated respectively by A, B and C.
|
Source: The European Network of Excellence on the Geological Storage of CO2
<< Previous page
---
Next page >>
TOP
|